Steel Demand Signals: Reading the Market Without Guessing
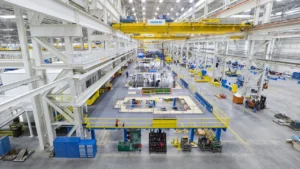
In global markets, few materials reveal the health of the economy quite like steel. From skyscrapers to pipelines, bridges to cars, steel lies at the heart of industrial growth. Because of this, investors, traders, and manufacturers treat changes in steel consumption as an early warning—or opportunity—signal for the broader economy. Yet despite this importance, many businesses still rely on “gut feeling” when anticipating steel trends. The truth is, the market leaves clues everywhere. By reading steel demand indicators properly, companies can make data-driven decisions rather than relying on guesswork.
This article explains how to interpret construction indexes, manufacturing PMI data, and capital expenditure signals to understand where global steel demand is heading. With these indicators, anyone involved in the industry—from mill operators to investors—can anticipate shifts before they happen.
Understanding Steel Demand Indicators
Steel demand indicators are measurable data points that reflect real changes in steel consumption and production activity. They combine economic, industrial, and logistical signals that together form a full picture of how much steel the world is using—and will need in the near future. The most commonly used ones include:
- Construction index – measures growth or contraction in infrastructure and building activity.
- Manufacturing PMI – signals industrial output trends through survey data from purchasing managers.
- Capex signals – track investment commitments that shape long-term steel demand.
- Import/export flow data – show cross-border demand for steel goods and semi-finished products.
- Inventory levels – indicate whether mills and distributors are holding excess stock or preparing for new orders.
Each of these indicators provides part of the story. Only by combining them can market participants form a complete, balanced view of steel’s trajectory. A rise in one indicator while others weaken, for instance, might reflect a short-term market imbalance rather than genuine growth.
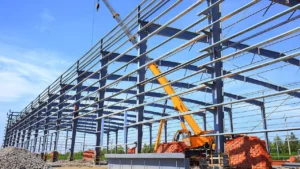
Construction Index: The Backbone of Steel Consumption
Construction is by far the largest consumer of steel worldwide, representing roughly half of total demand. That’s why the construction index serves as one of the most reliable barometers of steel consumption trends. When large-scale housing, infrastructure, or industrial projects accelerate, steel orders follow suit. Conversely, when construction slows due to higher interest rates or policy uncertainty, steel prices often drop within months.
For example, a rise in the Asian construction index in early 2024 correlated with increased orders for rebar, plate, and structural sections across the region. Conversely, the European index weakened later that year due to stalled infrastructure spending, which pushed regional steel mills to cut production. These correlations highlight how closely steel consumption shadows building activity.
Below is a simplified historical comparison:
| Year | Global Construction Index | Average Steel Consumption Growth |
|---|---|---|
| 2020 | 45 (contraction) | -7% |
| 2022 | 53 (expansion) | +5% |
| 2024 | 57 (strong expansion) | +9% |
This kind of data relationship makes construction indexes indispensable for anyone tracking future steel movements. A steady uptick in the index usually foreshadows increased orders within one to two quarters.
Manufacturing PMI: Early Warning for Steel Producers
The Purchasing Managers’ Index (PMI) is another key signal. It measures the health of the manufacturing sector, based on surveys that ask whether production, new orders, and employment are growing or shrinking. A PMI above 50 suggests expansion; below 50 signals contraction.
For steelmakers, PMI offers a clear early warning. When factories ramp up activity, demand rises for sheet, coil, and specialty grades. When PMI drops, steel producers often face slower sales and pressure to adjust production schedules. The correlation is especially strong in countries with large manufacturing bases such as China, India, and the United States.
Consider this example: In mid-2023, China’s manufacturing PMI rose from 49.2 to 51.1—its first expansionary reading in six months. Within weeks, mills reported stronger domestic orders for hot-rolled coil and flat steel products. This same pattern appeared in the U.S. in early 2024, where PMI data preceded a 6% rise in monthly steel shipments.
These signals make PMI one of the fastest, most widely watched leading indicators for short-term steel demand. Combined with construction trends, it helps forecast the balance between industrial and infrastructure-driven consumption.
Capital Expenditure (Capex) as a Long-Term Signal
While construction and PMI offer near-term insights, capex signals reveal where steel demand is heading over the long term. Capital expenditure refers to large-scale investments in plants, infrastructure, and equipment. When corporations and governments commit new capex budgets, they’re effectively setting future demand for structural and industrial steel.
Historically, increases in global capex spending precede steel demand growth by six to twelve months. For instance, when the global energy sector expanded capex budgets in 2021 to build renewable power facilities, steel plate orders surged in 2022. The lag reflects the timeline required for project approvals, tendering, and fabrication.
Here’s a simplified overview of this relationship:
| Year | Global Capex Growth | Steel Production Growth (Following Year) |
|---|---|---|
| 2020 | -10% | -5% |
| 2021 | +15% | +9% |
| 2022 | +8% | +6% |
By monitoring capex announcements in construction, energy, and manufacturing, steel producers and traders can gauge how much future capacity to prepare for. Governments’ infrastructure spending programs are especially powerful drivers of these long-term signals.
Other Market-Based Steel Demand Indicators
Beyond the big three—construction index, PMI, and capex—several additional steel demand indicators enrich the picture. Freight rates, for instance, often move in sync with trade volumes. When shipping costs rise, it suggests higher export and import activity for commodities like steel coils or raw materials. Similarly, steel inventory data help identify when distributors are oversupplied or struggling to meet orders.
Energy prices also matter. Because steelmaking is energy-intensive, rising fuel costs can suppress production or shift pricing power from mills to buyers. Watching crude oil or electricity prices alongside steel inventories helps analysts gauge the true health of the supply chain.
Finally, the import–export ratio offers regional insights. A country importing more semi-finished steel than it exports, like Vietnam or Indonesia, is often experiencing construction-led growth. Conversely, an exporter-dominant region like Northern China might be facing domestic slowdowns even when overall steel output looks stable.

Using Data Instead of Gut Feel: How to Read the Market Objectively
Many fabricators and traders have traditionally relied on intuition to forecast prices or demand, but intuition can fail when markets shift quickly. Instead, using objective steel demand indicators helps build a clear, data-driven perspective. One effective method is to design a simple dashboard that consolidates metrics such as the construction index, PMI, and capex data in one view.
For example, an analyst could assign weights based on historical influence: 40% to construction, 30% to PMI, and 30% to capex signals. By calculating a weighted average of these indicators, trends become easier to interpret. When the combined index rises steadily for three months, it signals sustained expansion. A simultaneous decline across all three usually precedes a downturn in demand.
Visualization tools, from basic spreadsheets to professional analytics platforms, make this process faster. With live data feeds from economic sources or agencies like the Purchasing Managers’ Index surveys, steel businesses can now automate the tracking process entirely. The goal isn’t just to collect numbers but to create a feedback loop that transforms raw data into actionable intelligence.
Regional Perspectives: Asia, Europe, and North America
Steel demand behaves differently across regions, and understanding these distinctions is crucial. In Asia, where massive infrastructure and manufacturing projects dominate, construction indexes often lead the market. China, for instance, regularly uses state-led projects to stabilize demand, making its infrastructure spending a global benchmark for steel consumption.
India shows similar momentum, with both construction and capex indicators growing in tandem. The country’s ambitious housing and transport programs continually push steel utilization higher, reinforcing Asia’s role as the engine of global demand.
In contrast, Europe’s steel market depends heavily on the private construction sector and energy projects. PMI fluctuations here often outweigh infrastructure signals. Meanwhile, North America—particularly the U.S.—relies on a mix of industrial production and energy investment cycles. The correlation between PMI, oil prices, and capex spending often defines demand strength for American mills.
These regional differences emphasize that a single global forecast rarely applies everywhere. Instead, localized reading of steel demand indicators gives producers and investors a competitive edge by understanding each region’s unique drivers.
How Steel Producers and Traders Use Demand Indicators
Producers and distributors don’t just observe these indicators—they act on them. When PMI readings strengthen and construction indexes rise, many mills increase raw material purchases such as iron ore and scrap to prepare for higher output. Conversely, when inventory levels build up or capex spending slows, producers scale back production or offer discounts to move stock.
Traders, on the other hand, use demand signals to adjust pricing strategies and hedging positions. For example, a trader who spots falling PMI data may short futures contracts to protect margins. Conversely, when capex investment and construction growth align, they can take long positions in anticipation of higher spot prices.
This data-oriented behavior helps reduce risk exposure and build stability across the value chain. It also supports better customer planning—distributors can maintain optimal inventory levels, while end-users lock in purchase agreements before price increases occur.
Case Example: Reading 2025 Market Signals
Imagine a snapshot of early 2025. The Asian construction index climbs by 3%, signaling new infrastructure approvals. Global manufacturing PMI, however, dips slightly by 1.5 points, reflecting moderation in consumer goods production. Meanwhile, energy-sector capex increases sharply as countries invest in renewable and transmission projects.
By combining these signals, analysts can infer that steel demand will stay resilient but shift in focus—from manufacturing to infrastructure. Fabricators producing heavy structural components will benefit, while flat-steel producers tied to appliances or automotive markets may see stable but slower growth.
This analysis demonstrates how using multiple steel demand indicators prevents overreaction to short-term noise. Instead of panicking over a PMI drop, businesses can contextualize it within the broader capex expansion and construction momentum, gaining a more accurate picture of market direction.
| Indicator (Q1 2025) | Change vs. Previous Quarter | Expected Steel Impact |
|---|---|---|
| Construction Index | +3% | Higher demand for structural steel |
| Manufacturing PMI | -1.5 points | Stable or slightly lower flat-steel demand |
| Energy Capex | +8% | Rising plate and pipe orders |
By interpreting these indicators in combination, decision-makers can align production, pricing, and procurement strategies more effectively. It’s a strategy that separates smart forecasting from speculative guessing.
Conclusion: From Guessing to Knowing
Predicting steel demand doesn’t have to be an art—it can be a science. By following steel demand indicators such as the construction index, manufacturing PMI, and capex signals, market participants gain a fact-based understanding of supply and demand dynamics. These indicators turn uncertainty into clarity, allowing companies to respond early to both growth and contraction cycles.
The key takeaway is simple: data replaces emotion. When organizations rely on measurable metrics rather than instinct, they reduce risk, protect margins, and build more resilient supply chains. In an industry as volatile as steel, informed analysis beats speculation every time.
For manufacturers and traders alike, learning to read the market through data is the foundation of competitive strength. The next time someone “feels” that steel prices will rise, check the indicators first—because markets reward those who read, not those who guess.